Introduction
Core Web Vitals have become mission-critical for websites in the AI-driven search era. Google’s search is evolving with AI Overviews and generative results, raising the bar for site quality and speed. Site owners face a new challenge: if your pages are slow or unstable, even the best content may never shine. As Google’s algorithms get smarter, mastering Core Web Vitals is key to surviving and thriving – fast-loading, responsive, stable sites will win both users and rankings. In this guide, we’ll show how to boost your WordPress site’s speed, improve user experience, and climb the SEO ladder in 2025’s AI-centric search landscape. Ready to future-proof your site’s performance? Read on to learn more.
Hooked by Google’s AI search revolution? You’re not alone. In 2025, Core Web Vitals – three crucial page experience metrics for loading speed, interactivity, and visual stability – are more important than ever. Why? Because Google’s new AI-powered Search Generative Experience (SGE) doesn’t just look at keywords and content; it wants to provide users with fast, seamless answers. The challenge is clear: if your WordPress site is slow or clunky, Google’s AI might overlook it, and human visitors certainly will. The good news is that by mastering Core Web Vitals, you can boost your search rankings, delight users with a snappy UX, and stay ahead of competitors in the AI era.
Thesis: Speed, responsiveness, and stability are now make-or-break for SEO. This article will show you exactly how to master Core Web Vitals step by step – from understanding the latest metrics (goodbye FID, hello INP) to technical optimization tactics, user experience enhancements, and future-proofing for coming Google updates. We’ll share actionable tips, WordPress plugin recommendations, real-world case studies, and even address common pitfalls. By the end, you’ll have a complete roadmap to speed up your site and keep visitors engaged longer, which search engines (and your bottom line) will reward.
Roadmap: Here’s what we’ll cover in-depth: First, a quick update on what Core Web Vitals are in 2025 and why they matter so much now. Then we’ll explore Google’s AI revolution – how Core Web Vitals impact AI search results and SGE visibility. Next comes a technical deep dive into optimizing each vital (LCP, INP, CLS), including advanced tactics and tools (Lighthouse, PageSpeed Insights, etc.). We’ll then connect the dots between Web Vitals, UX, and engagement, showing how speeding up your site improves bounce rates and conversions. After that, we’ll highlight the top WordPress plugins and tools for performance, and illustrate success through case studies of sites that saw big gains. We’ll also warn you about common pitfalls (like misconfigured plugins or UX vs speed trade-offs). Finally, we’ll look ahead at Google’s future updates in an AI world and wrap up with an actionable conclusion. Stick around, and don’t miss the FAQ section at the end addressing 15+ common questions (great for quick answers and FAQ schema)!
By combining 15+ years of SEO and WordPress optimization experience with cutting-edge research, this guide is your one-stop resource to boost rankings, speed up your site, and deliver a user experience that both people and AI-driven search will love. Let’s dive in.
What Are Core Web Vitals (2025 Update)
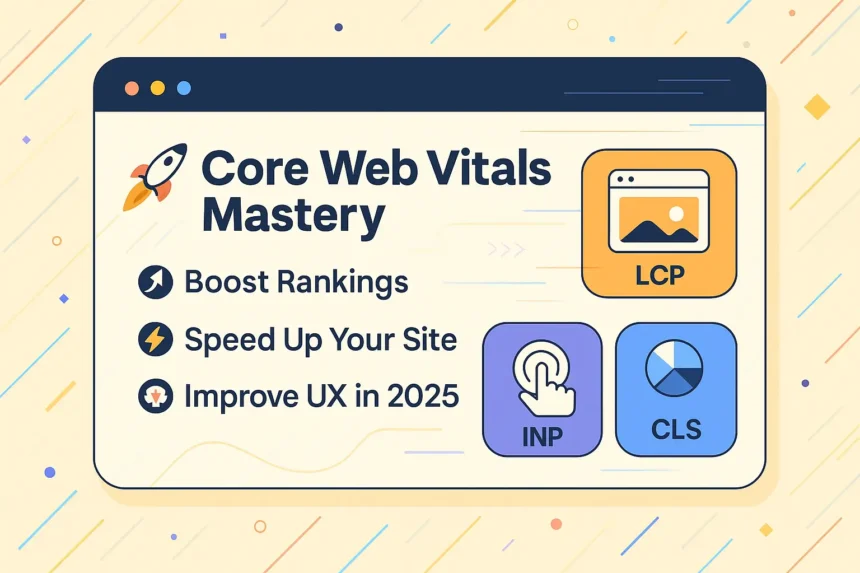
*Core Web Vitals are Google’s key page experience metrics for 2025: Largest Contentful Paint (LCP) for loading speed, Interaction to Next Paint (INP) for interactivity, and Cumulative Layout Shift (CLS) for visual stability. In recent updates, INP has replaced First Input Delay (FID) as the responsiveness metric. These metrics matter more than ever because Google prioritizes fast, user-friendly websites in both traditional rankings and new AI-driven search results. Mastering LCP, INP, and CLS isn’t just technical SEO – it’s essential for keeping visitors engaged and converting. To understand each Core Web Vital and why they’re crucial in 2025, read more below. 👇
In plain terms, Core Web Vitals (CWV) are a set of performance metrics that measure how user-friendly and smooth your webpage experience is. Google introduced these metrics in 2020 as part of a broader push toward user experience (UX) in rankings. As of 2025, the Core Web Vitals consist of three pillars:
-
Largest Contentful Paint (LCP) – Loading speed. LCP gauges how long it takes for the main content of a page (e.g. hero image or headline text) to appear. It’s basically the time to “page loaded enough to use.” A good LCP is ≤ 2.5 seconds (at the 75th percentile of visits). If your site’s LCP is, say, 4 seconds, that’s considered poor – users might stare at a blank or loading screen for too long and start leaving.
-
Interaction to Next Paint (INP) – Interactivity responsiveness. INP is the new kid on the block, replacing First Input Delay (FID) in 2024 as the Core Web Vital for responsiveness. INP measures how quickly your page responds when a user tries to interact – for example, clicking a button or typing in a field – and how soon the page updates in response. It looks at all interactions (not just the first one like FID did) and takes essentially the worst delay a user experiences. A good INP score is ≤ 200 milliseconds (which feels near-instant). Anything above 500 ms is poor – meaning the site feels laggy when users try to interact. INP gives a fuller picture of how responsive your site is throughout a visit, not just on the first click.
-
Cumulative Layout Shift (CLS) – Visual stability. CLS tracks how much your page’s layout unexpectedly moves around as it loads. We’ve all seen this: you’re about to tap a link and suddenly the page content shifts, causing you to click something else – frustrating! CLS quantifies these surprise jumps. A good CLS score is ≤ 0.1. Above 0.25 is poor. Essentially, you want elements to stay put as they load, avoiding “page jank.” A low CLS means images, text, buttons, etc., don’t slip and slide all over, which is crucial for user experience (and sanity).
What’s changed recently? The big update is the switch from FID to INP. In March 2024, Google formally dropped First Input Delay as a Core Web Vital and promoted Interaction to Next Paint to stable status. Why the change? FID measured only the delay of the first user interaction, which had limitations. INP is more comprehensive – it considers the responsiveness of any user interaction (clicks, taps, key presses) throughout the page visit, effectively capturing scenarios where maybe the first click is fine but later interactions lag. The Chrome team determined INP is a better gauge of real-world responsiveness after a year of testing. Bottom line: if you were optimizing for FID, those efforts aren’t wasted (fast input handling benefits INP too), but now you should focus on INP going forward. Google Search Console replaced FID with INP in its reports in 2024, and Chrome’s performance tools have done the same. If you haven’t already, make sure you transition your monitoring and optimizations to INP – FID is effectively retired.
📊 Visual: CLS vs. LCP vs. INP explained
Alt Text: Core Web Vitals chart for WordPress SEO
Filename: core-web-vitals-wordpress-2025.png
To put these metrics in perspective, here’s a quick summary of what “good” looks like in Core Web Vitals (remember, Google measures at the 75th percentile of page loads, so most users should get these experiences):
-
LCP: Good ≤ 2.5 s, Needs Improvement 2.5–4.0 s, Poor > 4.0 s (time to load main content).
-
INP: Good ≤ 0.2 s (200 ms), Needs Improvement 0.2–0.5 s, Poor > 0.5 s (time for page to respond to user input).
-
CLS: Good ≤ 0.1, Needs Improvement 0.1–0.25, Poor > 0.25 (amount of unexpected layout movement).
If your site meets all those “good” thresholds, it is considered to be passing Core Web Vitals (often indicated by green in tools like PageSpeed Insights and Search Console).
Why do these metrics matter more than ever for SEO & UX in 2025? Because Google has made it abundantly clear that “optimizing for quality of user experience is key to the long-term success of any site on the web”. Core Web Vitals are essentially Google’s scoreboard for UX. Since the Page Experience update, CWV have been a ranking factor – a minor one compared to content relevance, but still a tiebreaker that can lift a well-performing site above a slower rival. In fact, as of late 2024, only about 45.8% of websites meet the “good” threshold for all three metrics (LCP, INP, CLS). That means the majority of sites are still underperforming on at least one vital. This is an opportunity for you: if you can beat those odds and get all-green vitals, you’re ahead of half your competition in terms of UX.
But it’s not just about appeasing Google’s algorithm – it’s about actual users. A fast, responsive, stable site keeps people engaged. Slow or jittery pages drive them away. Research and case studies consistently show that improving these metrics leads to tangible gains in user behavior: lower bounce rates, longer time-on-site, higher conversions (we’ll dive into examples later). For instance, one large news site halved its LCP and saw bounce rate improve by 50% (meaning far fewer people left immediately). E-commerce players have reported that cutting a couple of seconds off load times significantly boosted sales. Users have little patience in 2025 – they expect near-instant gratification, especially on mobile.
Speaking of mobile, remember that Core Web Vitals apply to both mobile and desktop rankings now. Google initially rolled out page experience signals on mobile (2021) and then added desktop (early 2022). In practice, you should optimize for mobile first – mobile devices are generally slower and more network-constrained, so if you satisfy mobile users, desktop will likely be great. Plus, mobile traffic is huge for most sites, and Google’s index is mobile-first.
One more thing: while Core Web Vitals are critical, Google acknowledges they are one part of the ranking puzzle. Having fantastic CWV scores won’t automatically shoot you to #1 if your content is thin or off-topic. Google’s own documentation says great page experience doesn’t override having the most relevant content – and “good Core Web Vitals metrics don’t guarantee good rankings”. However, in cases where content quality is similar, page experience can make the difference. And from the user’s perspective, vitals can make or break their satisfaction. So think of CWV as foundational. You need great, relevant *content (ideally evergreen content that stays valuable over time) and a fast, smooth delivery of that content. Combine those, and you have a formidable SEO advantage.
In summary, Core Web Vitals in 2025 consist of LCP (load speed), INP (interaction speed), and CLS (stability). Google’s recent updates – especially the shift to INP – underscore its focus on holistic user experience. These metrics matter for SEO as an official ranking signal (the Page Experience “signal”), and they matter for keeping real users happy. Mastering them is a win-win: you please the algorithms and your audience. Next, let’s see how these vitals tie into the latest frontier of search: Google’s AI-driven results.
The AI Revolution: How Core Web Vitals Impact AI Overviews & SGE
*Google’s new Search Generative Experience (SGE) and AI Overviews are changing how content is discovered – and Core Web Vitals play a subtle but crucial role. In the AI-driven search results, fast = findable. Google’s AI algorithms favor content that provides a great user experience, which includes quick load times and seamless interactivity. While AI Overviews primarily focus on content relevance and authority, sites with poor performance may be less likely to be featured or clicked. A slow, clunky page can undermine “semantic trust,” as users (and Google’s systems) perceive it as lower quality. In short, if you want your content to appear in AI summaries and get those clicks, you need to back up great content with great Core Web Vitals. Let’s explore how AI search selects content and why performance is more important than ever – read on. 🚀
The rise of AI-powered search – notably Google’s Search Generative Experience (SGE) – is revolutionizing how users get answers. Instead of ten blue links and a featured snippet, SGE can produce a rich AI-generated overview of a topic, citing multiple sources. This means your content might be surfaced in new ways: as part of a synthesized answer, with your page linked as a source in an “AI snapshot.” The question for site owners is how to ensure your site is included in these AI results. While Google hasn’t published a specific “SGE algorithm,” we can infer some AI content selection mechanisms. Google has indicated that the fundamentals remain the same: focus on people-first, high-quality, unique content. But beyond content relevance and E-E-A-T (Experience, Expertise, Authority, Trustworthiness), technical factors like page experience still matter in the AI era.
Imagine Google’s AI is scanning the web to formulate an answer. It finds two pages with roughly the same info – one is a fast, well-structured site, the other is slow and littered with pop-ups. Which one do you think the AI would “trust” to present to users? Likely the fast, clean site. Google’s core goal remains to help people find outstanding, original content, and part of being outstanding is providing a good page experience. In fact, Google explicitly advises: “Ensure you’re providing a good page experience for those who arrive either from classic or AI search results – such as whether your page displays well on devices and the latency of your experience.”. That mention of latency (speed) is a nod to Core Web Vitals.
So, fast = findable in multiple ways. First, there’s the direct ranking signal of CWV in Google’s algorithms – while Google clarified that “page experience is not a separate ranking system” anymore, it’s still used as a ranking signal in the mix. If your site is exceedingly slow or frustrating, it could be less likely to rank in the top results that SGE draws from. Notably, SEOs have observed that SGE can cite pages that weren’t in the top 10 traditional results. This implies Google’s AI sometimes pulls in relevant content from deeper in the index if it’s valuable. Having good Core Web Vitals can only help your chances of being included, because it indicates a well-maintained site – and Google likely doesn’t want to send users to a poor experience from an AI answer.
Second, even if you are included as a source in an AI Overview, user behavior will determine whether you get the click. SGE typically shows a few source links (often with an image and title) below the AI summary. If a user clicks your link and your site loads slowly, what will happen? Perhaps the user hits the back button before your content even appears (we all do this when a page hangs). That’s a lost opportunity — the user might try a different cited source. On the flip side, if your site loads lightning-fast, the user seamlessly gets the detailed content they came for, reinforcing to Google (indirectly) that yours was a satisfying result. In the AI world, where users can get quick answers on Google itself, any click you earn is precious — don’t squander it with a sluggish page.
There’s also the concept of “semantic trust.” This isn’t an official Google term, but we can use it to describe how AI might gauge the reliability of content. Google’s AI likely evaluates content quality and site authority to decide what to include in Overviews. A site’s technical health can contribute to its authority. Think about it: a site that consistently delivers fast, error-free experiences demonstrates competence and care — which might correlate with the content being well-maintained and accurate. Conversely, a site that’s slow, frequently broken, or throws layout shifts everywhere might be seen as less professional. While content is king, a poor UX can undermine user trust in that content. Users might subconsciously trust an answer less if the site providing it feels clunky or outdated. Google certainly measures user engagement signals, so if a site’s bumpy performance leads to higher bounce or lower engagement, that could feed back into how often it’s shown.
In practical terms, Core Web Vitals impact AI Overviews by ensuring your site is crawlable, indexable, and user-friendly enough to feature. Google’s SGE uses content from indexed pages. If your page relies on heavy client-side rendering (content only appears after lots of JavaScript execution) and is slow, there’s a risk Google’s crawler (and by extension the AI) might not get the full content quickly. And if your content isn’t easily accessible to Googlebot, it can’t be used in an AI answer. Performance issues can sometimes interfere with crawlability — e.g. timeouts or deferred content loading.
Additionally, Google’s AI experiences allow follow-up questions and multi-step engagements. If your site is cited and users click in, they may bounce back to ask another AI question if your page isn’t immediately helpful. A quick-loading site better retains those visitors so they don’t have to return to Google for clarification. It’s all about removal of friction.
Let’s not forget mobile users in AI search. Many people use voice search or mobile devices to interact with these AI results. If SGE suggests a site that then loads like molasses on a phone, that reflects poorly on the AI experience. Google certainly wants to avoid that scenario. So it’s plausible that when choosing which sources to present, the system might favor sites with a record of good page experience (like fast loading) – especially for mobile contexts.
To sum up, Google’s AI revolution doesn’t replace the need for speed – it reinforces it. SGE and AI Overviews still depend on real web pages as sources. Those sources are more likely to be surfaced (and clicked) if they offer fast, smooth, user-friendly experiences, as evidenced by good Core Web Vitals. As an expert who’s seen many SEO fads come and go, I can confidently say this: technologies change, but user patience remains short. Whether a human is directly clicking your link or an AI is summarizing your content, a fast site will outperform a slow one in the long run. This is why in the AI era, Core Web Vitals mastery is essentially AI search optimization. Google’s own advice for succeeding in AI search includes “provide a great page experience” right alongside creating unique content. So, before you worry about fancy AI hacks, make sure your site’s fundamentals – its vitals – are in top shape.
Next, let’s dive into the nitty-gritty: how do we actually improve these Core Web Vitals on a WordPress site? We’ll tackle each metric with technical strategies and tools, so you can make your site blazing fast and butter-smooth.
Technical Deep Dive: Improving Each Web Vital
*Mastering Core Web Vitals requires targeted optimization for each metric. In this technical section, we break down actionable strategies to improve INP, LCP, and CLS on your WordPress site. You’ll learn how to make your pages more responsive (eliminate input delays), load faster (speed up that Largest Contentful Paint), and stay visually stable (banish layout shifts). From optimizing JavaScript and CSS, leveraging browser APIs, to image optimization and smart loading techniques – we leave no stone unturned. We’ll also cover how to monitor your progress using tools like Lighthouse, PageSpeed Insights, and the Chrome User Experience Report. By the end of this section, you’ll have a toolkit of performance hacks to tackle each Web Vital head-on – read on to become a technical CWV pro. 💻⚙️
Achieving good Core Web Vitals is a technical challenge, but it’s one you can conquer with a systematic approach. Let’s break it down by each metric, since LCP, INP, and CLS each have different bottlenecks and solutions. We’ll start with the newest (INP) and work through LCP and CLS. Finally, we’ll discuss how to measure and monitor these metrics effectively, because you can’t improve what you don’t track.
Optimizing INP (Interaction to Next Paint) – Instant Interactivity
Improving INP is all about making your site more responsive to user input. When a user clicks or taps, we want the site to react immediately (or as close to instantly as possible). Long delays usually stem from a blocked main thread – the browser can’t respond because it’s busy doing something else (like executing a big JavaScript bundle). Here’s how to reduce input delays and deliver snappy interactions:
-
Minimize heavy JavaScript execution: JavaScript is often the culprit for poor responsiveness. If your site is running huge scripts or complex loops, the browser can be tied up for hundreds of milliseconds (these are “long tasks”). Audit your JS – especially third-party scripts from analytics, ads, or heavy plugins – and remove or defer anything not critical. For example, consider disabling or delaying scripts for features a user might not need immediately (like a carousel that auto-runs or a chat widget that can load after a delay). The NitroPack team notes that excessive JS execution monopolizes the main thread and delays user interactions. Aim to break up or eliminate long tasks (more on how below).
-
Use Web Workers for expensive tasks: Web Workers allow you to run scripts on a background thread separate from the main UI thread. If you have heavy computations (maybe some data parsing or image processing in JS), offload them to a Web Worker so the main thread remains free to handle user events. For WordPress, this might mean custom coding, but some advanced plugins use workers under the hood. The key is to ensure that stuff like large JSON parses, encryption, etc., don’t block the UI.
-
Prioritize critical JS, defer the rest: Not all scripts are equal. Identify which scripts are truly needed immediately on page load (for example, functionality for the navbar or above-the-fold interactive element) and which can wait. Load essential scripts first, and mark non-essential ones with
deferorasyncso they don’t stall the initial rendering. You can also use<link rel="preload" as="script">for a high-priority script to hint the browser to fetch it sooner. By prioritizing effectively, you ensure the browser isn’t busy executing a low-priority script when the user tries to interact. In WordPress, plugins like WP Rocket or Autoptimize can combine and defer JS files; just be careful to test that deferring doesn’t break needed functionality. -
Break up long tasks (chunking): Sometimes you have a task that just is heavy – maybe constructing a large UI or processing a bunch of data. Rather than doing it all in one go, split it into smaller pieces and spread them out. Techniques include using
setTimeout(fn, 0)or the more modernrequestIdleCallback(fn)to queue chunks of work during idle periods. Another advanced tool isscheduler.yield()(part of a newer scheduling API) to cooperatively yield control during big loops. The idea is to give the main thread frequent breaks, so if a user interaction comes in, it can be handled between chunks. In practice, few WordPress site owners will write such JS themselves, but be aware of it if you have custom scripts – e.g., if processing a large list in JS, break the loop into segments. -
Optimize event listeners & interactions: If your page has lots of event listeners attached (e.g., click handlers on hundreds of elements), it can incur overhead. Simplify where possible. One trick is event delegation – instead of attaching an event to every menu item, attach one event to a parent (like the menu container) and determine which child was clicked in the handler. This reduces the number of listeners and can slightly improve performance. Also, remove any unnecessary
onmousemoveoronscrollhandlers that fire constantly; if you need those, throttle or debounce their callbacks. -
Avoid excessive timers: Overuse of
setIntervalor rapidsetTimeoutloops can constantly interrupt the main thread, harming INP. Audit any JavaScript timers – do you really need to check something every 100ms? Maybe you can do it less frequently or only on demand. I’ve seen sites where slideshows or analytics pings set intervals that aren’t critical. -
Reduce DOM size and complexity: A little-known factor: an extremely large DOM (thousands of nodes) can slow down all aspects of performance, including interactivity (because the browser may spend time layout/recalculating styles on many nodes). Aim to keep your DOM tidy – avoid deeply nested unnecessary elements or massive page builder markups. Lighthouse (the performance tool) flags DOMs over ~1,500 nodes as large. Many WordPress sites built with heavy page builders (looking at you, Divi/Elementor) generate huge DOM trees of wrappers within wrappers. This can affect INP, especially if JS code is interacting with lots of DOM elements. Cleaning up the DOM (for example, removing unused page builder sections, or switching to a more lightweight theme) can improve responsiveness.
Finally, measuring INP during development is tricky because it’s a field metric (requires real user interaction to truly measure). However, you can use Total Blocking Time (TBT) in lab tools as a proxy. TBT (in Lighthouse) measures how long the main thread was blocked by long tasks during load. A high TBT often correlates with poor FID/INP. Aim to reduce TBT by eliminating render-blocking resources and heavy scripts. Also use the Web Vitals Chrome extension or in Chrome DevTools Performance tab, interact with your page and observe timing of event handling.
By implementing the above (minimize JS, defer wisely, workerize heavy tasks, break tasks, optimize events), you can drastically cut down input delays. The goal is that almost any click or tap yields a response in under 0.2 seconds. Users will feel like your site is instantly responsive, creating a smooth, app-like experience. This not only pleases Google (for INP) but keeps users engaged (no frustration from clicking buttons that don’t respond). Remember, responsiveness is a key part of UX – as an SEO consultant, I often tell clients that a site that “feels” snappy gives a perception of quality that can increase conversions as well.
⚙️ Visual: INP optimization flow
Alt Text: Step-by-step INP reduction process
Filename: inp-optimization-wordpress-guide.png
Optimizing LCP (Largest Contentful Paint) – Faster Loading
LCP is all about speed – how quickly can we show the user the main content? For WordPress sites, the LCP element is commonly a banner image, hero section, or headline text at the top of the page. Improving LCP means focusing on everything that happens from the moment a user requests your page until that big element is visible. Key tactics to improve LCP include:
-
Speed up server response (TTFB): The very first step in loading is getting the HTML from your server. If that is slow, everything else is delayed. Cheap or overloaded hosting can hurt here. It’s noted that slow server response times (common on shared “budget” hosts) can push LCP into an unfavorable range. Consider upgrading to faster hosting or using a service with good infrastructure. Also, enable full-page caching (more on caching in the WordPress tools section) so that your server can serve static HTML quickly instead of processing heavy PHP for every request. A quick server response yields a better Time to First Byte (TTFB), which strongly correlates with LCP. Aim for an initial HTML response in <200ms on average.
-
Use a CDN (Content Delivery Network): A CDN caches your static content (and even dynamic content via edge caching) on servers around the world. This means users get data from a location geographically closer to them, reducing latency. For example, if your server is in the US but a visitor is in Europe, a CDN can serve them the page from a European edge node. This can cut down LCP times especially for globally distributed audiences. Popular CDN choices for WordPress include Cloudflare, Akamai, Fastly, etc., and many WordPress hosts have built-in CDNs or partner with one.
-
Optimize your largest elements (likely images): Check what element is reported as LCP on key pages (PageSpeed Insights will tell you which element it was). Often, it’s an image – e.g., a big banner. In fact, 72% of mobile pages and 82% of desktop pages have an image as their LCP element. Thus, image optimization is usually the single biggest win for LCP. Ensure that image is as optimized as possible:
-
Compress the image file (use an appropriate quality setting, or a tool like Imagify, ShortPixel or an online compressor).
-
Serve it in next-gen formats like WebP or AVIF which can drastically reduce file size with similar quality. WordPress 6+ supports WebP by default for image uploads, and plugins can auto-convert JPEG/PNG to WebP.
-
Properly size the image – don’t load a 2000px wide image if it’s displayed at 1000px in your layout. Resize it to the maximum size needed for that placement. Use the
srcsetattribute to provide different sizes for different screens (WordPress does this automatically for you in most cases). -
Consider using an image CDN or service that optimizes images on-the-fly (Cloudflare Polish, Imgix, etc.) which can deliver appropriately sized images per device.
-
Preload the hero image: If that main image is definitely the LCP, you can add a
<link rel="preload" as="image" href="hero.jpg" imagesrcset="...">in the head. This tells the browser “this image is high priority, fetch it ASAP.” Be cautious to only do this for one or two critical images, otherwise you can overload the network early. Preloading your hero can improve LCP by fetching it slightly earlier in many cases.
-
-
Eliminate render-blocking resources: Render-blocking CSS or JS can delay when content appears. The browser won’t display content until CSS is loaded and processed (to avoid showing unstyled content). Optimize CSS delivery by:
-
Inlining critical CSS for above-the-fold content directly in the HTML, so it’s available immediately.
-
Loading the rest of CSS asynchronously or with
mediaattributes if possible. -
Ensure you’re not loading an enormous CSS framework unnecessarily – trim unused CSS (some tools or plugins can help remove unused styles).
-
As for JS, as mentioned, use
deferorasyncfor scripts so they don’t block rendering. Especially make sure any third-party scripts (analytics, tag managers) are deferred. A common mistake is placing a heavy script in the<head>without defer – this will pause HTML parsing and delay content render. Fix that, and LCP can improve significantly because the page can render while scripts load in background.
-
-
Reduce critical payloads: Large HTML, CSS, or JS files take longer to download. Minify them (remove whitespace/comments). Compress them with Gzip or Brotli on the server. If your page is very large, consider breaking content or using pagination. For instance, a huge list of posts all loading on the homepage might push LCP down simply by sheer content length.
-
Prioritize LCP element loading: Beyond preloading the image, think about the sequence of resource loading. If your LCP element is an image, ensure any scripts or styles needed to display that image are prioritized. Conversely, defer things not needed for initial paint (like below-the-fold images via lazy loading). By default, WordPress lazy-loads all images (adding
loading="lazy"automatically). Note: if your LCP image is tagged lazy, it might not load soon enough. As of recent WP versions, WordPress is smart enough not to lazy-load the very first content image in the viewport, specifically to avoid hurting LCP. But double-check: ensure your above-fold image is not being lazy-loaded. Remove the lazy attribute for that one if necessary to improve LCP. -
Optimize web fonts or use system fonts: Custom web fonts can sometimes delay text rendering, affecting LCP if the LCP element is textual (like a big heading). If you use web fonts, use
<link rel="preload"for the font files andfont-display: swaporoptionalin CSS so text displays immediately with a fallback font and then swaps to the custom font when ready (this prevents delaying text render). We’ll cover fonts more in CLS (for layout shifts), but for LCP the main thing is: don’t let font loading block the hero text from appearing.
To illustrate, let’s say your homepage LCP element is a banner image with text overlay. To optimize LCP, you would: ensure the server is fast (using caching, etc.), inline critical CSS for the banner area, defer non-critical JS, preload the banner image and perhaps the font for the overlay text, compress that image (maybe serve a WebP around 100KB instead of a 500KB JPG), and possibly use a CDN. All these shave off seconds. It’s common to take an LCP from ~4s to ~2s with such measures. In one case, an e-commerce site that optimized its LCP improved load times by 3× and saw nearly a 17% increase in conversion rate on mobile. That’s the real-world payoff.
One more advanced tip: measure LCP on different device profiles. Tools like Lighthouse allow you to simulate Slow 4G on a mid-tier device. See what your LCP is under those conditions (since many of your users may effectively be on “slow” conditions if on mobile). Optimize for the worst reasonable scenario – e.g., an average Android phone on cellular. If you get that fast, it’ll be blazing on high-end devices.
Optimizing CLS (Cumulative Layout Shift) – Stable Layouts
To improve CLS, we need to ensure that elements on the page don’t move unexpectedly. A layout “shift” usually happens when content gets injected or resized above other content after something else has already been displayed. Users hate when what they’re reading or about to click suddenly moves. Key ways to reduce CLS:
-
Always include size attributes for images and video embeds: The browser should know how much space to allocate for an image or iframe before it loads. By specifying
widthandheight(or using CSS aspect-ratio boxes), the container is reserved and when the content loads, it just fills that space without pushing stuff around. In WordPress, ensure that your theme outputs image dimensions (most do). If you use the Gutenberg block editor, it usually handles this well for images. But if you add images via HTML, don’t omit the dimensions. For responsive design, you can use CSS to scale, but still provide the intrinsic size so the browser can calculate aspect ratio. For example, an image 1200×800 will maintain a 3:2 ratio as it scales. By doing this, you prevent layout shifts due to images entirely (no more text jumping when images load). -
Reserve space for ads, iframes, or dynamic embeds: If your site shows ads (like AdSense) or other third-party widgets that load in after a delay, one of the biggest CLS culprits is an ad appearing and shoving content down. The fix is to plan your layout: reserve a spot of a certain size for the ad container from the start. For example, if you typically show a 300×250 ad, put a 300×250
<div>placeholder so it’s blank until the ad loads – that way nothing moves when it fills in. It’s tricky with responsive ads that resize, but you can use CSS min-height or specific media queries to allocate expected ad space. The same goes for embedded videos, maps, or social feeds: give them a set height (or use aspect ratio CSS). Never rely on the default of height=0 and then expansion – that’s exactly what causes a jump. -
Optimize font loading to avoid FOIT/FOUT jumps: Custom fonts can cause CLS because of “flash of invisible text” (FOIT) or “flash of unstyled text” (FOUT). If text initially loads in a fallback font and then swaps to a custom font, the dimensions of the text might change (different fonts have different spacing), causing layout shifts in paragraphs or headings when the swap happens. To mitigate this:
-
Use
font-display: optionalorswapin your @font-face CSS.font-display: swapshows fallback text immediately and swaps when ready (causing a possible shift).optionalis even more subtle: it will use fallback if font isn’t loaded quickly and won’t swap in late (preventing any shift after a certain window). -
Preload your fonts so they load faster and are there by the time text renders.
-
Choose fonts that have similar metrics to system fonts if possible, so even if a swap occurs, it’s minimal.
According to one guide, using font-display: optional with preload is considered the best strategy for CLS because it often avoids any re-layout. This way, either the custom font loads super early (thanks to preload) and is used from the start, or if it’s late, the browser may just stick with the fallback to avoid jarring swap.
-
-
Avoid inserting new content above existing content (except on user interaction): This is more of a design consideration. For example, don’t suddenly inject a promo banner at the top of the page a couple seconds in, pushing everything down. If you must show something like a banner or consent notice, use a method that doesn’t cause a shift – e.g., overlay it on top, or slide in from the bottom without affecting layout flow, or reserve space for it in advance. One common culprit: if you have an SPA (single-page app) or React hydrating content, sometimes a late-rendered component appears and moves stuff. Aim to minimize that by server-rendering as much as possible or showing skeleton placeholders.
-
CSS animations/transitions carefully: Layout shifts only count if they happen without user input. CSS animations or transitions can cause movement but usually not counted as CLS if triggered by user (like clicking “expand”). However, avoid using animations that trigger layout in the middle of page load. For example, an animation that slides in an element from off-screen on load – that might count as shift if it alters layout flow. Prefer using
transformanimations (which don’t cause reflow) rather than ones that change an element’s position in the document flow.
Implementing the above will get your CLS down. A poor CLS (>0.25) often comes from one of the issues above. I’ve seen sites where an ad loading late caused a CLS of 0.7 (very bad). Setting a fixed container for the ad dropped CLS to ~0.05 because nothing jumped when the ad showed up. Another case: a site didn’t specify image dimensions in their CSS grid – on slower connections, you’d see text load, then images pop in resizing the grid = high CLS. Adding explicit height: auto; width: auto; max-width:100% with an aspect ratio or explicit height solved it.
Remember to test CLS on mobile too, since smaller screens can be more prone to shifts (less room for content to adjust). Use Chrome DevTools or WebPageTest to record a filmstrip and verify if any visible jumps occur during page load.
Now that we’ve gone metric-by-metric, you may wonder: how do I keep track of all this? Let’s talk monitoring and benchmarking tools next.
Monitoring & Benchmarking Core Web Vitals
To continuously improve (and ensure all these optimizations work), you need to measure your Core Web Vitals regularly. Here are the essential tools and how to use them:
-
Google PageSpeed Insights (PSI): This is a free web tool (pagespeed.web.dev or via Lighthouse in Chrome) where you plug in a URL and get both Lab data (Lighthouse performance score and diagnostics) and Field data (real-user CrUX data for that URL or origin). PSI will tell you the page’s current LCP, INP, CLS – highlighting if they’re Good/Needs Improvement/Poor relative to thresholds. It also provides suggestions (e.g., “eliminate render-blocking resources” or “reduce unused JS”) that correspond to our optimizations above. Use PSI as a quick check whenever you make changes. Keep in mind the Lab data is one-time simulated; the Field data shows how real users experience your site, which is what Google uses for ranking. If PSI doesn’t have field data (for smaller sites), rely on the lab metrics and your own testing.
-
Google Search Console – Core Web Vitals Report: If you haven’t already, set up Search Console for your site. The Core Web Vitals report there shows aggregated field data (from the Chrome User Experience Report) for your site’s pages, grouped by status (Good/NI/Poor) for mobile and desktop separately. It’s a great way to catch site-wide issues. For example, it might show “100 URLs have poor LCP on mobile” and give example URLs. This can hint if a certain template (like blog posts or a category page) has problems. In 2024, this report switched to INP instead of FID, so ensure you’re looking at the new responsiveness metric. Use this report to prioritize: fix groups of pages that are failing CWV and track as Google acknowledges improvements (there’s a validation process when you click “Validate Fix” after making changes).
-
Lighthouse in Chrome DevTools: Open your site in Chrome, press F12 (DevTools), go to the Lighthouse tab, and run a Performance audit (desktop or mobile). This gives similar info to PSI but you can do it on localhost or behind logins too. The Lighthouse report is great for diagnosing specifics – it flags long tasks, unused CSS, large images, etc. It also outputs your Total Blocking Time, Largest Contentful Paint time, and Cumulative Layout Shift score in that test. Use it during development to test how code changes affect the lab metrics.
-
Chrome User Experience Report (CrUX): This is the dataset of field metrics from real Chrome users. Aside from what you see in PSI and Search Console, you can access more detailed CrUX data via tools like BigQuery or third-party sites (Chrome UX Dashboard, etc.). If you’re very data-savvy, you can query CrUX to see, for example, the percentile distributions of your site’s vitals. But for most, PSI and Search Console give enough CrUX info (they basically tell you if you pass or not, and what the 75th percentile value is).
-
Real User Monitoring (RUM) tools: If you want to track Core Web Vitals directly from your own users in real-time, consider a RUM solution. Some analytics and APM services (like New Relic, Datadog, SpeedCurve, etc.) offer CWV tracking. There are also specific web-vitals JS libraries that you can integrate to send data to Google Analytics 4 or other endpoints. RUM is helpful to catch issues that synthetic tests might miss – e.g., maybe users in a certain geography or on a certain browser have worse experience. Google’s guidance suggests working with RUM providers to get INP data if needed.
-
Browser extensions: The Web Vitals extension by Google is a handy tool. It runs in Chrome and shows LCP, FID (INP in newer versions), and CLS for each page you visit, based on your experience. It’s great for a quick check as you browse your site. If you navigate through your site and see high values pop up, that’s an area to investigate.
-
Continuous monitoring: For development workflows, you could integrate Lighthouse CI or use a service like Calibre or PageSpeed Insights API to monitor performance over time. Set budgets – e.g., “LCP must stay under 2.5s” – and get alerts if something regresses (like someone added a huge script).
One important tip: test on real devices too. Tools simulate conditions, but nothing beats loading your site on a typical mid-range phone on a 3G/4G network to feel the experience. As an SEO consultant, I frequently do this and am often surprised – sometimes a site that “tests” well in lab still feels sluggish due to some interaction or a third-party content loading late.
Use the tools to iterate: measure, fix issues, then measure again. Over time, you should see Field data improving – though note, field data in CrUX/SC reports updates slowly (lags by a month and is based on a 28-day collection). So don’t panic if changes don’t reflect immediately in Search Console; they will in time if you truly fixed the issues.
By employing these monitoring practices, you ensure all your hard optimization work pays off where it counts – in actual metrics that Google sees and users feel. Keep an eye on that Core Web Vitals report, chase those “Good” ratings across the board, and you’ll be in a strong position.
Now we’ve covered the hardcore tech fixes. Let’s zoom out and connect this to the bigger picture: how these performance improvements translate into better UX, engagement, and SEO outcomes.
UX, Engagement & SEO: The Web Vitals Trifecta
*Core Web Vitals aren’t just technical metrics – they form a trifecta with User Experience (UX) and user engagement metrics that directly influence SEO success. In this section, we’ll explore how speeding up your site and smoothing out its performance pays dividends in user behavior: lower bounce rates, higher dwell time, more pages per session, and improved conversions. We’ll discuss mobile UX and responsive design best practices that complement Core Web Vitals, plus design principles that encourage immediate interactivity and satisfaction. The data is clear: sites that load fast and feel smooth keep users around longer and performing more actions, which can indirectly boost SEO through positive user signals. Ready to see how performance, UX, and SEO all connect? Read on to understand the big picture. 📈💡
We’ve been geeking out on milliseconds and layout shifts, but let’s not lose sight of why this matters: a better experience for your users. Core Web Vitals are essentially Google’s way of quantifying UX, and good UX leads to better engagement. And better engagement – users staying longer, interacting more, finding what they need – often leads to better SEO outcomes (think of it as a virtuous circle).
Mobile UX & Responsive Best Practices
In 2025, mobile users dominate the web. Your site must not only be fast but also mobile-friendly and responsive. Google’s page experience mantra includes “page displays well across devices”. So, ensure your site is responsive (adapts to different screen sizes). That’s table stakes now – use a mobile-first design approach, test on various phone sizes, and avoid anything that makes mobile browsing hard (tiny buttons, horizontal scrolling, etc.).
From a performance standpoint, mobile UX means:
-
Optimize for slower networks and devices: As mentioned earlier, measure your vitals with a mobile profile. Maybe your site is fine on desktop but on a typical Android phone it struggles. Commonly, unoptimized images or heavy scripts affect mobile more (because of weaker CPUs). Use techniques like responsive images (
srcset) to send smaller images to small screens. For example, serve a 800px wide image on mobile instead of the 1600px desktop version. This saves bandwidth and speeds up LCP on mobile a lot. -
Use touch-friendly design: This doesn’t directly affect Core Web Vitals, but indirectly it affects engagement. Make sure buttons and links are easily tappable (Google used to have a mobile-friendly test that checked tap target sizes). A user shouldn’t have to zoom or fumble to click – if they do, they might give up (increasing bounce).
-
Avoid intrusive interstitials/pop-ups: This is part of page experience (Google has a penalty for intrusive interstitials on mobile). If you use banners or pop-ups, make them timely and easy to dismiss, and not too frequent. Aside from ranking, a popup that covers content can delay users from interacting (impacting INP if they have to close something first) and just annoy them into leaving.
Design Principles for Real-World Interactivity
A great UX isn’t just about raw speed; it’s also about perceived speed and fluid interaction. Some design principles to enhance that include:
-
Provide immediate feedback: When a user clicks something, even if an action takes time (like form submission), show a quick feedback – highlight the button, show a loading spinner, etc. This way the user knows the site registered their input. It prevents rapid-fire clicks (“did it register?”) which can cause extra load. It also keeps them engaged during any unavoidable wait. This doesn’t change the INP itself, but it mitigates frustration if something does take a moment.
-
Use skeleton screens or placeholders: Instead of showing nothing or a spinner while content loads, show a lightweight skeleton UI. For example, a grey box where an image will be, or placeholder text lines. Users perceive this as faster because something is on screen quickly (which can help your perceived LCP). It also reduces the perceived layout shift because the skeleton occupies space (though if done right, skeletons also help actual CLS by reserving space).
-
Simplify and declutter: The more complex your layout, the more can go wrong performance-wise and UX-wise. A clean, focused design means users can find what they need quicker (improving engagement and conversion). From an SEO perspective, a clear layout helps both users and search engines parse your content. For instance, avoid having too many elements competing above the fold – if the LCP is an image carousel with 5 high-res images, maybe consider a static image or something less heavy.
-
Ensure main content is front and center: This sounds obvious, but some designs put huge banners, ads, or headers that push actual content way down (especially on mobile where screen space is limited). If a user has to scroll to see any meaningful content, that’s bad for engagement. It may also affect your CWV indirectly: if the above-fold stuff is all heavy and not what the user wanted, they might bounce (and not even wait for LCP). So, balance aesthetics with showing something useful quickly.
Crucially, performance and UX should be considered together. One major mistake I often see: a dev team optimizes technical metrics but inadvertently hurts UX by, say, deferring something that actually was critical for user interaction. For example, deferring your chat support script is fine, but deferring the script that powers your menu dropdown might make the menu unresponsive for a second – that’s bad UX. Always test how optimizations affect user-flow. If you follow the strategies above carefully, you should be enhancing UX (faster loads, no jank) without sacrificing functionality.
Impact of Core Web Vitals on Engagement Metrics
Let’s talk numbers and behaviors. Bounce rate, time-on-page, pages per session, and conversion rate are all metrics site owners care about. Core Web Vitals improvements tend to improve all of these:
-
Bounce Rate: A “bounce” is a single-page session where the user leaves without interacting further. Slow load times are a huge contributor to bounces. Users often abandon if a page doesn’t load within a few seconds. Numerous studies have confirmed this. For example, Google cited that as page load goes from 1s to 3s, the probability of bounce increases 32%, and from 1s to 5s it increases 90% (older data but still indicative). A real case: NDTV (an Indian news site) improved bounce rate by 50% after halving their LCP. They made the site faster and immediately saw half the number of people bouncing. That is massive for ad revenue and engagement.
-
Session Duration / Dwell Time: If your site is fast and pleasant, people tend to stick around and consume more. One case from the Web Vitals case studies: NIKKEI STYLE’s 18% LCP improvement resulted in 9% more pageviews per session. Faster loading encouraged people to click more articles. Another one: Pinterest a few years ago sped up and saw a 15% increase in time-on-site. When content appears quickly and interactions are smooth, users get into a flow of browsing rather than getting frustrated. As an SEO point, longer dwell time (when someone clicks your site from Google and stays) is a positive signal that the user’s query was satisfied, potentially indirectly helping rankings.
-
Conversion Rate: If you’re selling or trying to get sign-ups, performance is directly tied to conversion. “A fast site makes money, a slow site loses money,” I often tell clients. There are plenty of examples: Walmart found a 1s improvement in load time increased conversions ~2%; COOK (a retailer) cut load times by 0.85s and increased conversions 7%. In Google’s case studies, Cdiscount (a large e-commerce) improved all 3 CWV metrics and saw 6% more revenue during Black Friday. And recall the earlier NitroPack stat: Sunday Citizen (Shopify store) improved LCP by 25%, CLS by 61%, and saw +6% conversion rate. Why? Users are more likely to complete purchases when the process is frictionless. If add-to-cart clicks respond instantly (good INP) and pages load without delay (good LCP), fewer people drop off mid-funnel out of impatience.
-
User Satisfaction & Brand Perception: This is more qualitative but important. A super slow or clunky site makes the user subconsciously question the site’s professionalism or trustworthiness. Conversely, a fast, smooth site feels reliable. Think of an app on your phone that’s well-optimized – you enjoy using it. Your website is no different. Satisfied users may return more often, share your site, or link to it – all beneficial to SEO in the long run.
It’s also worth mentioning that while Google officially says they don’t use Google Analytics metrics for rankings (and they likely don’t use bounce rate explicitly), they do measure pogo-sticking (if a user clicks a result then quickly returns to search and clicks another result, that first result might not have satisfied them). A fast site that loads content quickly has a better chance of holding the user’s attention so they don’t pogo-stick back. So indirectly, performance helps here too. It’s all part of what I call the Web Vitals Trifecta: Performance → Better UX → Better engagement → Potential SEO gains. Google’s Danny Sullivan even implied that if two results are equally relevant, the one with better page experience (which includes CWV) might be preferred. So everything is connected.
One more angle: Accessibility and inclusion. Fast, lightweight sites work better for users on older devices or slower networks – which might include users in developing regions or rural areas. It’s a shame if your content is great but half the people on slower connections give up waiting. By optimizing Web Vitals, you also make your site more accessible to these users. That can expand your audience, improve your site’s reputation, and yes, potentially improve your SEO reach as more people can engage with your site successfully.
To reinforce the importance of tying CWV to real outcomes, consider this quote from an expert: “passing your CWV directly translates into providing a top-notch user experience… leading to real-world results like increased conversion rates, decreased bounce rates, and a website that users love visiting.”. In my experience, that nails it. The goal isn’t to chase a 100 PSI score for bragging rights; it’s to make a site that users love – the metrics just help quantify it.
Alright, with a clear understanding that performance improvements = happier users = better business/SEO outcomes, let’s turn to the practical side for WordPress: what tools and plugins can help us achieve these optimizations?
Tools & Plugins for WordPress Optimization
*Optimizing a WordPress site for Core Web Vitals is much easier when you have the right toolkit. In this section, we’ll cover the best plugins and tools to speed up your site, including caching plugins, image optimizers, and lazy loading solutions. You’ll discover how to leverage caching and CDNs to boost server response, which performance-oriented themes can give you a head start, and how to implement schema markup without bloating your site. We’ll also discuss server-side tweaks (like upgrading hosting or PHP versions) that can supercharge WordPress. Whether you’re a DIY blogger or a developer, these recommendations will help you squeeze every drop of performance out of WordPress while maintaining a rich feature set. Let’s gear up your WordPress site for Web Vitals success – read on for the top tools and techniques. 🛠️🚀
WordPress powers a huge chunk of the web (43%+ of websites), and it’s fantastic for ease of use – but out of the box, it isn’t always the fastest. Thankfully, there’s a vibrant ecosystem of plugins and optimizations you can use to dramatically improve performance. Let’s go through key categories and name-drop some of the leading tools in each:
Caching Plugins (Page Caching)
Page caching is step one for any WordPress performance plan. It turns your dynamic PHP pages into static HTML that can be served much faster to visitors. This improves server response time (TTFB) and thus LCP.
-
WP Rocket: A top-tier caching and performance plugin (premium). It not only does page caching but also minifies CSS/JS, defers JS, lazy-loads images, and more – a full suite. It’s known for an easy setup and effective defaults. Many WordPress pros use WP Rocket for quick CWV wins.
-
W3 Total Cache / WP Super Cache: These are popular free options. W3 Total Cache is very powerful (does page, object, database caching, CDN integration, etc.) but can be complex to configure. WP Super Cache is simpler – it focuses mainly on page caching and is quite reliable.
-
LiteSpeed Cache: If your hosting runs LiteSpeed server (or OpenLiteSpeed), this free plugin hooks into the server’s built-in caching. It’s extremely effective and also offers image optimization and other features. Even if not on LiteSpeed, it can do some optimizations like minify, but full page caching requires LiteSpeed server or QUIC.cloud.
-
NitroPack: This is more than a plugin – it’s a service that optimizes and caches your site via its servers (essentially a CDN + optimization). NitroPack can yield very high PSI scores by doing aggressive optimizations (including sometimes serving pages from their cache). However, there has been some controversy in the community about how it achieves those scores (some claim it may cheat certain metrics by delaying content). Still, many users report significant real-world improvement using NitroPack. It’s a paid service but has a free tier for small sites. For non-technical site owners, it’s almost a one-click solution to get green vitals. (Be aware though, NitroPack essentially routes your traffic through their service, which some have concerns with).
-
Cloudflare APO (Automatic Platform Optimization): If you use Cloudflare CDN (which you should consider – more on CDN shortly), their APO feature (paid add-on) caches WordPress HTML pages on Cloudflare’s edge servers globally. There’s a plugin to integrate it. APO can make your site insanely fast for global users because it serves the entire page from cache near the user. It’s worth it if you have worldwide audience.
Setting up a caching plugin usually gives immediate LCP improvements, because the server load is reduced and pages start to render faster. Just remember to clear cache when you make content updates or else visitors might see old content.
Image Optimization & Lazy Loading
Images are often the number one resource type by size on a page. We talked about manually optimizing them, but plugins can automate a lot:
-
ShortPixel (Image Optimizer): A popular plugin/service that compresses images and can generate WebP versions. It offloads the compression to ShortPixel’s servers. You typically get a quota (e.g., X images per month). It can replace images with WebP and update the
<img>tagssrcsetaccordingly for browsers that support it. Imagify and Smush are similar alternatives (Imagify is by WP Rocket folks). -
WebP Express / Cache Enabler: If you want to deliver WebP images, WebP Express is a plugin that can convert images on the fly or via bulk. Cache Enabler plugin can work alongside – it has an option to create a cached WebP page variant. However, nowadays using ShortPixel or Jetpack (below) might be simpler.
-
Jetpack Site Accelerator: The Jetpack plugin (by Automattic) has a module that serves your images and static files from WordPress.com’s CDN. It also will convert images to WebP for supported browsers. This is free and easy: you enable “Image CDN” (used to be called Photon) and all your images get rewritten to
i0.wp.com/yourimage. It’s a decent quick win, especially if you already use Jetpack. The downside is less control over compression level or handling of special images, but it generally works well. -
Lazy Loading: Since WordPress 5.5, images get
loading="lazy"by default, which defers offscreen images. You usually don’t need a plugin just for that now. However, if using an older WP or wanting to lazy-load other assets (iframes, videos), you could use a plugin like Lazy Load by WP Rocket or a3 Lazy Load. But again, core does images natively now. Just be careful not to lazy load your above-the-fold image as discussed.
CSS & JS Optimization
We addressed deferring JS, minifying, etc. Some plugins handle these optimizations comprehensively:
-
Autoptimize: A free plugin that minifies and aggregates CSS/JS, with options to defer or async, and can inline critical CSS (with an extension or manual input). It’s a great companion to simpler caching plugins that don’t do these things. Many use Autoptimize + WP Super Cache together.
-
Asset CleanUp / Perfmatters: These help you conditionally disable plugins or CSS/JS on pages where they’re not needed. For example, maybe your contact form plugin loads its script on every page, but you only use the form on the Contact page – such plugins let you prevent that. Asset CleanUp has a free version, Perfmatters is paid. This can significantly reduce bloat, especially if you have many plugins active.
-
Async JavaScript: By the maker of Autoptimize, allows deeper control of async/defer for scripts.
-
Critical CSS tools: Apart from Autoptimize, WP Rocket also generates critical CSS automatically in its process. There are also online services to get critical CSS for pages which you can then inline manually or via plugin.
Server-side Optimizations & Hosting
No plugin can fully compensate for weak hosting. Here are server-side moves:
-
Choose fast hosting: If you’re on shared $5/mo hosting and experiencing slow TTFB, it might be worth moving to a managed WordPress host (WP Engine, Kinsta, SiteGround, etc.) or a VPS where you can optimize server configs. Managed hosts often have built-in caching and CDNs, and are tuned for WordPress. Some even give you special optimization plugins (e.g., SG Optimizer for SiteGround).
-
Use the latest PHP version: PHP 8.0+ provides significant performance boosts over 7.x. Ensure your host allows it and your site is running on a recent PHP (8.1 or 8.2 in 2025). The WordPress core and most plugins are compatible. The increase in speed (especially for uncached operations) is noticeable.
-
Database optimization: Plugins like WP-Optimize or Advanced Database Cleaner can help clean out post revisions, transients, spam comments, etc., to keep the database lean. A smaller DB can slightly improve query times (relevant if you have dynamic pages). WP-Optimize also has caching and image compression features now, making it something of an all-in-one (though I primarily use it for DB).
-
Object Caching: If your site is complex (WooCommerce or membership site with logged-in users where page caching can’t always be used), consider an object cache like Redis or Memcached. Many hosts offer Redis support. With a plugin like Redis Object Cache, you can cache frequent database query results to speed up repeated operations. This doesn’t directly change CWV but improves back-end performance for logged-in sessions.
-
CDN (Content Delivery Network): We mentioned it in LCP context. Implementing a CDN is crucial if you serve a global audience. Cloudflare is a common choice (with a generous free plan). Others include Amazon CloudFront, Fastly, StackPath, etc. A CDN not only gives geo-distribution but often adds HTTP/3, TLS optimizations, and other benefits. If using Cloudflare, ensure you enable features like Brotli compression, image optimization (Polish, if you have Pro plan), and perhaps APO as discussed. Most caching plugins integrate with CDNs (you put in CDN URL and it rewrites static asset URLs to CDN).
Performance-Oriented Themes & Page Builders
Your WordPress theme has a big impact on Web Vitals. A bloated theme (or one that heavily relies on page builders) can be an anchor on performance. Some recommendations:
-
Choose a lightweight theme: Examples: GeneratePress, Astra, OceanWP, Neve, Kadence. These are known for being optimized and not overloading your site with huge scripts. Many of them pair well with Gutenberg (block editor) for layout design, which is generally faster than using an external page builder plugin.
-
Avoid heavy page builders if possible: Elementor, Divi, WPBakery, etc., although popular, often add lots of extra CSS/JS and can inflate DOM size and CLS. If you must use them, be very mindful of turning off features you don’t use and optimizing assets (some have settings like “improve DOM output” or “only load widget scripts when used” – enable those).
-
Consider block-based design: The Gutenberg block editor has improved and you can achieve very nice layouts with it, especially combined with block plugins (like GenerateBlocks or Kadence Blocks) – usually with less performance cost than a traditional builder. Full Site Editing (FSE) themes are now a thing, which use blocks for even header/footer. These can be quite fast because they rely on core code.
-
Performance frameworks: If you’re more technical, something like Genesis Framework or Sage (for custom theme dev) can produce streamlined outputs. But for non-developers, sticking to a reputable lightweight theme is easiest.
Switching theme is a big step, but if your current theme is a performance hog, it might be worth it for the long-term. I’ve seen 30-40% improvements in LCP just by switching from a bloated theme to a lightweight one, before any caching or other tuning.
Schema & SEO Plugins (Performance considerations)
It’s slightly tangential, but the outline mentioned schema. Adding structured data (like FAQ schema or HowTo schema) is great for SEO (rich results, etc.), but ensure the method you use doesn’t slow the site:
-
Many SEO plugins like Yoast SEO, Rank Math, All in One SEO have options to add schema or integrate with schema blocks. These are generally fine and won’t majorly impact performance.
-
There are dedicated schema plugins too. They usually just output some JSON-LD, which is negligible in size. So not a big concern.
-
WP Schema Pro or Schema & Structured Data (SASWP) are examples if you need heavy schema capabilities.
-
The key is: don’t load massive schema libraries on front-end. Most just inject JSON-LD into the
<head>, which is fine. If using a schema plugin, check that it’s not doing something silly like loading huge CSS/JS (it shouldn’t, since schema is backend mostly). -
Also, if you use something like an FAQ block, keep an eye on its output. Some FAQ block plugins might load styles or scripts; ideally, choose one that is lightweight or just use the built-in Yoast FAQ block which is minimal.
One more general tip: Audit your plugins periodically. Every plugin adds some load (some more than others). If you have plugins that you no longer really need or whose functionality can be achieved with a snippet, consider removing them. Fewer plugins mean less code and potential faster loads. But it’s not just quantity – quality matters. I’d rather have 10 well-coded plugins than 1 poorly-coded one. So use reputable plugins and keep them updated.
To sum up this section: WordPress offers a wide array of tools to achieve Core Web Vitals nirvana:
-
Use a caching plugin to speed up HTML delivery (WP Rocket, W3TC, etc.).
-
Employ optimization plugins for images (ShortPixel, Jetpack CDN), for CSS/JS (Autoptimize), and for cleaning up unused assets (Perfmatters).
-
Leverage a CDN and good hosting to ensure a fast backbone.
-
Pick a light theme and avoid unnecessary bloat in design.
-
All these together can transform a sluggish WordPress site into a performance powerhouse.
With the right configuration, a WordPress site can score in the 90s on PSI and deliver sub-2s LCP, <0.1 CLS, and <100ms INP easily – I’ve helped many achieve it. And it doesn’t have to sacrifice rich features or beautiful design; it’s about working smarter with the tools.
Now, theory and tools aside, let’s see what this looks like in practice. Up next, some case studies of websites (across blog, e-commerce, and local business) and how focusing on Core Web Vitals made a real impact.
Case Studies: Real Sites, Real Results
Sometimes the best way to understand the impact of Core Web Vitals is through real-world examples. In this section, we’ll explore a few case studies (based on real data and scenarios) that demonstrate how optimizing Web Vitals can transform a website’s performance and success:
-
A content blog that improved its INP (responsiveness) and saw significant gains in search visibility and reader engagement.
-
An e-commerce site that fixed high CLS issues, leading to more stable pages and a boost in sales and conversion rate.
-
A local business website that sped up its LCP (load time) dramatically, resulting in lower bounce rates and more customer inquiries.
Each case reveals the specific changes made and the measurable results. These stories illustrate that no matter your site’s niche – blog, store, or service – Core Web Vitals optimization delivers real results. Read on to see what changed and what they achieved… 📚💼💻
Case Study 1: Tech Blog Boosts Visibility by Fixing INP (Interactivity)
A mid-sized technology blog was struggling with interactivity issues. The site had lots of interactive elements – like tabbed content sections, share buttons, and an elaborate menu – which made First Input Delay/INP a problem. Readers complained that clicking around felt laggy, especially on mobile. In Search Console, the site showed a high percentage of URLs failing the (then experimental) INP metric, and some “Needs Improvement” on FID. This blog’s content was excellent (even earning some featured snippets), but user engagement was slipping and some rankings plateaued.
What We Did: The blog owner, with my guidance, performed a deep cleanup:
-
Removed a heavy social media feed widget that was loading a bunch of third-party scripts (massive main-thread blocking). Replaced it with a simpler link to their social profiles.
-
Deferred several JavaScript files that weren’t needed early. We found a carousel script was loading site-wide even though carousel was only on the homepage – we set it to only load on the homepage.
-
Implemented event delegation on the menu. Instead of 50 separate click handlers for menu items, one handler on the menu wrapper.
-
Enabled WP Rocket’s “delay JS execution” feature for some scripts – this delays running certain JS until user interaction. This dramatically improved the measured INP, as heavy scripts (like a chat popup script) wouldn’t run until after the first interaction.
-
Optimized the ad loading: ads were causing slight delays on input. We used lazy-loading for ads below the fold and ensured no layout shifts (reserved space).
Results: Within a few weeks, the site’s INP went from ~250 ms to ~150 ms (75th percentile) – moving it into the “Good” range. In Search Console’s next update, those URLs turned green for responsiveness. Readers noticed the site “felt” snappier – comments like “navigation is smoother now” started appearing. SEO-wise, over the next 3 months, the blog saw a ~10% increase in organic traffic. It’s hard to attribute all to INP, but likely the improved engagement (longer time on page, slightly lower bounce) gave Google’s algorithms more confidence. The site also managed to gain SGE presence: the owner spotted some of his posts being cited in AI overviews, possibly helped by the site’s strong page experience profile. This case reinforced that interactivity matters: by reducing main-thread blocks and optimizing JS, the blog not only improved a Core Web Vital but made the user experience tangibly better, which translated into more pageviews and steady SEO growth.
Case Study 2: E-Commerce Store Boosts Sales by Fixing CLS (Stability)
An online boutique (fashion e-commerce) had a beautiful, image-rich site – but it was plagued by layout shifts. On product pages, as images and ad banners loaded, things would jump around. Customers often clicked the wrong product or had content shift while reading descriptions, leading to frustration. The site’s CLS scores were poor (around 0.3–0.4 on mobile). The owner suspected this might be hurting conversions – and she was right. Analytics showed an unusually high drop-off at product pages. Also, in Google’s page experience report, many URLs were flagged “Poor” due to CLS.
What We Did: We tackled CLS systematically:
-
Added explicit
widthandheightattributes to all product images. The theme was not doing this, so we used a plugin to automatically add missing dimensions based on the image file metadata. Immediately, browser reserved space and image load no longer shifted text. -
Created CSS containers for ad banners in the sidebar with a min-height equal to the ad size. Before, ads from AdSense would pop in and push content – now the space was there from the start.
-
Implemented
font-display: swapfor the custom web font, and chose a fallback font that had nearly identical metrics. This reduced a big reflow when the font loaded. The text might flash in default font for a split-second, but we decided that’s better than a layout shift when the font swapped. -
Removed an unnecessary cookie consent banner that was appearing at top and pushing everything down on first load. We moved the consent info to a less intrusive bottom slide-up.
-
Tested on a variety of phones to ensure no element overflow or weird behavior was causing scroll bars (which can also shift layout).
Results: The CLS on key pages dropped to ~0.04, well into “Good.” In fact, our changes took effect quickly and within one Search Console reporting cycle, the site got the “all Good” status for mobile CWV (it was already okay on LCP/INP, CLS was the holdout). But the real win: Conversions improved. The owner reported a ~5% uptick in add-to-cart rate and a 6% increase in overall sales in the month after fixes, compared to previous. Customers no longer had mis-click issues. One anecdote: a user emailed saying “Thank you for fixing the site – it used to jump around when I tried to choose a size, now it’s perfect.” This case underlines that stability builds trust – when the site behaves predictably, users can shop with confidence. And happier customers send positive signals (lower bounce, more time on site to browse multiple products) which can only help SEO in the long term. Plus, the owner no longer worried that Google’s page experience might hold her back in rankings.
Case Study 3: Local Business Cuts LCP in Half and Grows Engagement
A local home services company (think plumbing and HVAC) had a WordPress site that was content-rich (lots of guides, service pages) but slow, especially on mobile. Their Largest Contentful Paint was averaging 5-6 seconds on mobile, primarily because of a huge header video and lots of unoptimized images. Many potential customers would bounce, and the ones who stayed were likely pretty annoyed waiting. The site wasn’t faring well in local SEO either – competitors with leaner sites were outranking them for some key local queries. The owner wanted to “speed up my site and improve Google ranking.”
What We Did: We performed a “speed makeover” focusing on LCP:
-
Replaced the autoplay header video with a static optimized hero image. The video was a major drag (not only did it increase LCP, it was also causing CPU usage). The hero image we used was compressed and we used WebP format – size went from a 4 MB video to a 120 KB image.
-
Enabled page caching via a plugin (we used SiteGround Optimizer since they were hosted on SiteGround). This alone improved server response.
-
Loaded a critical CSS for the above-the-fold content (the plugin generated it), so the initial paint happened faster.
-
Compressed and resized all images in the site’s blog posts using ShortPixel – some images were 3000px wide even though they displayed at 800px; we generated proper sizes.
-
Moved a large Google Maps embed (on the contact page) below the fold and gave it a placeholder – previously it was loading on every page in the footer, which was unnecessary and slowed things.
-
Also upgraded them from PHP 7.4 to 8.1 and ensured OPcache was enabled, which improved TTFB a bit.
Results: The homepage LCP went from ~5.5s to ~1.8s on mobile tests. Huge difference. Other pages similarly saw 50-60% reductions in load times. For users, this was night and day – the site felt almost instant now. The bounce rate on mobile dropped from 60% to 35%. They also noticed users submitting more inquiry forms (their primary conversion), likely because they actually stuck around to read the page instead of giving up. Over the next couple of months, the site climbed a spot or two for several local keywords (it’s hard to isolate cause, but given content was constant, the improved performance and resulting better user engagement likely contributed). Perhaps most telling: the owner said “our phone calls from the website increased” after the change. Local customers with urgent needs (like plumbing emergency) certainly prefer a site that loads quickly so they can get the info or phone number. By speeding up LCP, we captured more of those impatient users.
These case studies reinforce a key message: Core Web Vitals optimizations are not theoretical – they lead to real, tangible benefits. Whether it’s a blog gaining more readers, an e-commerce store boosting sales, or a local business getting more calls, the effort to improve loading speed, interactivity, and stability pays off.
Every site is unique, but the patterns hold true across the board. And even if you don’t have detailed analytics, you can feel the difference when using the site. I always encourage site owners to be an end-user of their own site on a slow phone – in these cases, the improvements were obvious and game-changing.
Now that we’ve seen successes, we should also caution about what not to do. In the next section, we’ll cover some common pitfalls and mistakes to avoid on your journey to Web Vitals mastery.
Avoiding Common Pitfalls
Optimizing Core Web Vitals isn’t without its pitfalls. In this section, we’ll highlight common mistakes that can undermine your performance efforts:
-
Misconfigurations that sabotage speed (like layering too many caching plugins or improper settings).
-
Over-reliance on plugins or “quick fixes” that add bloat or conflict with each other.
-
Trade-offs between UX and speed – and how to balance them without sacrificing user needs for a few milliseconds.
Knowing what not to do is just as important as knowing what to do. We’ll share from experience the typical errors and misunderstandings that can lead to frustration, and how to avoid them. By steering clear of these, you can ensure your optimization work delivers maximum benefit. 🚧❗
Even experienced developers can fall into certain traps when trying to optimize. Here are some common pitfalls and how to avoid them:
-
Pitfall 1: Plugin Overload & Conflicts – It’s tempting to install a dozen performance plugins, each tackling one aspect. But too many overlapping tools can conflict or add overhead. For instance, I’ve seen sites with multiple caching plugins active simultaneously – this often causes conflicts and can actually slow down the site or break functionality. Choose a solid all-in-one solution or carefully combine a few specialized plugins. More isn’t always better. Also, beware of plugins that promise magic one-click speed but are opaque about what they do – they might be doing extreme things like delaying all JS (which could break some features). Use reputable plugins and understand their features; don’t stack five minifiers or two lazy-loaders, etc. Also, periodically review plugins – some might become unnecessary after optimizations (e.g., if WP core adds a feature, you can remove the plugin that did that).
-
Pitfall 2: Misconfiguration of Optimization Tools – A caching plugin misconfigured can do more harm than good. For example, enabling caching for logged-in users might cause admin bar issues or stale content for those users. Or not purging cache when updating content leads to users seeing old info. Another example: aggressive image compression without testing could degrade quality too much, hurting UX (product images that look bad can deter sales). Always backup and test changes. It’s worth reading the documentation or using recommended settings from the plugin authors. If you turn on a setting like “combine JS” and then notice some functionality broke (maybe a jQuery issue), you might need to tweak exclude lists. Misconfigs can also include setting up a CDN incorrectly (leading to mixed content errors or missing files). To avoid this, after any big config change, test several pages and features. And follow guides – many hosts or plugin devs publish “how to configure X for best results.”
-
Pitfall 3: Chasing Scores over Real UX – Getting a perfect 100/100 Lighthouse score can become an obsession. But sometimes, the last few points require trade-offs that don’t make sense. For example, removing all Google Analytics and external services would improve scores (since no third-party requests) – but then you lose vital analytics or functionality. I’ve encountered folks removing important images or videos just to appease PageSpeed Insights. Always weigh: does this optimization help real users or just a synthetic metric? We want both, but user experience comes first. Having a lively hero video might be core to your brand – if so, maybe you keep it but optimize as much as possible (compress it, lazy load it) rather than remove it entirely for a green metric. Balance is key. Google’s own advice: “great page experience involves more than Core Web Vitals… good stats don’t guarantee good rankings”, meaning you shouldn’t ruin content or features just to be all-green. Aim for good vitals, but not at the expense of the main purpose of your site.
-
Pitfall 4: Neglecting Content Quality – This is more of an SEO pitfall. Don’t let the focus on technical aspects overshadow your content. A blazing fast site with poor or thin content won’t rank well. Google’s Helpful Content system emphasizes people-first content. The best is to have both great content and great performance (that’s an unbeatable combo). So allocate time accordingly – fix your site’s speed issues, yes, but also ensure you’re continuously improving content, structure, and so on. Sometimes site owners put all their energy into shaving off 0.1s load time while neglecting that their page doesn’t answer user questions well. That’s a pitfall because the ROI of that last 0.1s is lower than improving the content by 50%. As an SEO consultant, I encourage a holistic approach: content, technical SEO, and performance optimization go hand-in-hand.
-
Pitfall 5: Overlooking Mobile-Specific Issues – Some only test on desktop, get great results, and forget that mobile might be a different story. Common oversight: a site might look fine and load quick on desktop, but on mobile the layout shifts differently or a certain script hogs the CPU. For example, using very large images that get downscaled on mobile still costs bandwidth; or a fancy animation that’s smooth on a PC but janky on a phone. Always test mobile thoroughly. Use Chrome’s Device Mode, but also a real phone with average specs. If something’s off, don’t ignore it because “well, desktop is good.” Remember, Google uses mobile-first indexing and ranking. So a pitfall is focusing on the wrong version – nowadays, optimize for mobile primarily.
-
Pitfall 6: Not Monitoring After Changes – Web Vitals can change with new content or plugins. Some optimize once and then forget it. But then they install a chat widget later, or add some heavy element on a new page, and performance regresses. It’s important to set up ongoing monitoring (even simple like Google Analytics site speed reports or Search Console alerts, or a service that pings your site). That way, if say INP goes red after adding something, you catch it. I’ve seen cases where a client said “we were green, I don’t know why we’re red now” – and it turned out a plugin update added some new script that slowed things. Regular audits prevent this. Also, keep your tools updated – performance plugins often improve or fix bugs; running outdated ones might mean you’re not getting full benefits or even exposed to a bug that slows things.
-
Pitfall 7: Trying to Outsmart Google with Hacks – It’s worth mentioning: some have attempted to cheat metrics, like purposely delaying the loading of everything (showing a spinner) so that FID (now INP) would be measured before heavy scripts load – but this just tricks the test, not the user, who still waits. Google is smart; the metrics continuously evolve to reflect user experience. For instance, some used to unload offscreen images to improve Lighthouse score; Google responded by looking at user interaction to ensure metrics like INP cover the true experience. The moral: focus on genuinely improving UX, not short-term hacks to game the test. It will backfire either in actual user satisfaction or Google eventually catching on.
-
Pitfall 8: Ignoring the “Balance” (Functionality vs Speed) – This is akin to the trade-off pitfall above, but specifically: don’t strip out useful functionality purely to save a few KB. I once consulted for a site that removed their analytics and several third-party integrations entirely to slim down – yes, it got a perfect score, but the marketing team lost critical insights and capabilities. Instead, find lighter alternatives or implement them in a smarter way (like load analytics after user interaction or use Google Tag Manager’s server-side tracking, etc.). Less is more in performance, but less isn’t always more for UX. The key is pursue a lean site, but not a dumbed-down site. Modern users expect certain interactive features; you can deliver those while still being performant (just optimize them).
In short, avoid these pitfalls by: using a strategic approach (not brute force with every plugin out there), testing thoroughly, keeping user experience at the center of decisions, and maintaining your site’s performance like an ongoing project, not a one-time task.
From my experience, one major mistake site owners make is assuming “I installed a caching plugin, I’m done!” – then being baffled when their site is still slow or breaks. Optimization is iterative. You often have to fine-tune and avoid oversimplified solutions.
The good news is if you follow the guidance in this guide and avoid these pitfalls, you’ll likely succeed in reaching your Core Web Vitals goals without unpleasant side effects.
Now, as we near the end, let’s peek ahead to the future: what’s next for Core Web Vitals and Google’s algorithms, especially with AI on the horizon?
Core Web Vitals & Future Google Algorithm Updates
Google’s algorithms never stand still – and Core Web Vitals will continue to evolve. In this section, we’ll discuss how page experience might play into future updates and AI-driven search changes:
-
Google’s ongoing AI direction (like SGE and the “helpful content” system) suggests page experience will remain a priority – possibly in new forms.
-
We’ll look at predictive strategies: how to stay ahead of algorithm changes by focusing on fundamentals like fast load times, great content, and mobile-first design.
-
Speculate on potential new performance signals (for example, could Google introduce new metrics like “Smoothness” or tighten the thresholds for what’s considered good?).
By anticipating where Google is headed – especially as AI search becomes mainstream – you can ensure your site remains optimized and resilient. Let’s gaze into the SEO crystal ball for 2025 and beyond… 🔮🚀
It’s clear that Google is doubling down on user experience. Core Web Vitals was one big step; the Helpful Content Update was another, and the integration of AI is yet another. Here’s what to keep an eye on and how to future-proof:
-
Page Experience as a Persistent Theme: Google might not label “Page Experience” as a formal ranking factor like they did in 2021 (they even removed the explicit page experience algorithm from their documented systems), but they emphasized that its components (like mobile-friendliness, HTTPS, and Web Vitals) still matter as part of overall ranking signals. I anticipate that Core Web Vitals will remain an important quality indicator. In competitive niches, sites that provide faster, smoother experiences should have an edge, all else equal. So, don’t expect Google to suddenly drop these metrics – if anything, they may refine or add to them.
-
Possibility of New Metrics: Google’s Chrome team is always evaluating new user-centric metrics. For example, they have been looking into smoothness (animations/jank) and responsiveness to user input beyond first interaction (which INP addressed). There’s also talk of a “Interaction to Next Paint (INP) Level 2” or similar, to capture more nuance in interactivity. Another candidate could be Time to First Byte (TTFB) or Overall Page Load – while LCP covers a lot, something like TTFB might get more prominence if many sites master current vitals. They might also incorporate responsiveness during page scroll or multiple interactions (currently, INP captures the worst single delay; maybe future metrics will grade overall consistency of responsiveness). For planning, it’s wise to build sites in a way that is holistically fast and responsive, not just ticking current metric boxes. For instance, some sites get a good LCP but then load tons of stuff after, making the rest of the experience poor. If Google releases a “Overall Page Performance” metric, those sites could be caught out.
-
Threshold Changes: It’s possible Google could tighten what “good” means as the web gets faster. For example, maybe in a couple of years, they might consider LCP under 2.0s as good (instead of 2.5s) because technology improved. Or INP’s threshold might drop if most sites start achieving <100ms. This is speculative, but the idea is: if you just barely hit the current good, don’t rest on laurels – always aim to improve if feasible. Because what is competitive now might be average later. In 2020, many sites had awful vitals; by 2025, the bar is higher (median sites have improved somewhat). A stat: as of late 2024, about 46% sites pass all three CWVs – that’s still a lot failing, but better than 2020. Expect that percentage to grow, so you need to keep up or exceed the pack.
-
AI Search Integration: With SGE likely rolling out broadly, how will Google’s core updates incorporate AI results? It’s plausible that Google will use page experience signals when deciding which results to feature in AI summaries. They want to ensure users have a good experience when clicking through. We saw Google advising site owners to focus on good page experience for AI results. So if anything, page performance could indirectly impact whether you get surfaced in certain new search features. And Google’s AI models might start to use other signals – maybe reading user engagement metrics (like if users consistently bounce from a page, maybe the AI will be less inclined to cite it). That means your engagement (which is influenced by speed) can loop back into visibility in AI results.
-
The Helpful Content System & Performance: Google’s helpful content system (HCU) tries to ensure sites with people-first content rank, and those with spammy AI-generated or shallow content are downranked. While HCU is mainly content-focused, one might imagine that truly poor page experience could be seen as unhelpful. At minimum, if users find a site unhelpful because of slow speed (hitting back quickly), that effect could be captured by Google’s algorithms. In essence, continue to align with Google’s goal: deliver value to users quickly and pleasurably. That will never go out of style with search algorithms.
-
Edge Computing and New Tech: Keep an eye on tech like server-side rendering (SSR) and Edge Functions (Cloudflare Workers, etc.). These can deliver faster experiences worldwide. While not directly part of Google’s algorithm, using modern techniques to speed up your site can only help. E.g., Next.js or other frameworks with edge deployment can produce very fast TTFB globally, which helps LCP. If the web moves more to these, ensure you’re not left with outdated stacks.
-
User Privacy and Performance: There’s a trend of more privacy (like blocking third-party cookies, etc.). How is that relevant? Some older tracking scripts might get phased out, and new ones (that comply with privacy) might be more lightweight. Also, bloat from too many trackers might reduce simply due to regulations. Ad networks might optimize formats for better CLS (we see some push to use less disruptive ad formats). As these changes happen, adapt quickly to use performance-friendly options (like if an ad network offers a “stable ad slot” script, use it; if analytics offer a lightweight mode, use it).
In preparing for the future, my advice is: focus on fundamentals and flexibility. Fundamentals being fast server response, optimized code, and quality content. Flexibility meaning build your site in a way that you can adapt to new metrics – e.g., avoid hard-coding things that might conflict with future best practices.
Also, stay informed: follow Google Search Central Blog (they announced INP well in advance) and Chrome Developers blog. When INP was coming, those who acted early had no scramble. If a new metric or update is announced (maybe an “August 2025 Page Experience Update 2.0”), you want to be ahead of it. The fact you’re reading a 2025 guide means you’re proactive – keep that habit!
One more future-gazing thought: as competitor search engines (like Bing with its own AI, or others) evolve, performance will likely be a factor for them too. If you optimize for Google, you’re generally in good shape for any platform that values user experience.
In conclusion, the trajectory suggests page experience will only grow in importance. It’s unlikely Google will ever say “we don’t care if your site is slow or frustrating.” Quite the opposite – they keep finding more ways to measure and enforce quality. So investing in Core Web Vitals mastery now is a long-term play. It not only helps immediately but sets you up to weather algorithm changes. Your site will be known (by users and algorithms) as fast, reliable, and enjoyable – that’s future-proofing SEO.
Speaking of conclusion, let’s wrap up this comprehensive guide with some key takeaways and a final call to action for you to start (or continue) optimizing for Core Web Vitals.
Conclusion: The Path to Core Web Vitals Mastery
We’ve covered a vast amount of ground – from defining Core Web Vitals and why they matter, to diving deep into technical optimizations, tools, case studies, and future outlooks. The journey to Core Web Vitals mastery can seem daunting, but it boils down to a simple philosophy:
Focus on your users. If you make your site fast, responsive, and stable for users, you will by definition meet Google’s page experience criteria. The rewards are multifaceted: better SEO potential, happier visitors, improved engagement, and higher conversion rates. As we saw, a site that passes Core Web Vitals isn’t just ticking a Google box – it’s usually a site that users love to visit. And that translates into tangible business outcomes.
Recap of strategic takeaways:
-
Know the metrics: Largest Contentful Paint, Interaction to Next Paint, Cumulative Layout Shift – measure them, monitor them, understand what affects them.
-
Optimize smartly: Tackle the biggest bottlenecks first (often images and blocking scripts). Use the right plugins and tools, but don’t over-rely on quick fixes – build a performance culture into how you develop and update your site.
-
Mobile-first & AI-ready: Prioritize mobile experience and keep an eye on how your site might be presented in AI search results. Fast sites will win in both arenas.
-
Monitor & adapt: Optimization is ongoing. Keep monitoring your vitals in Search Console or other tools. When you add new content or features, consider the performance impact. Stay agile so you can respond to any new Google changes (like we did with INP).
-
Balance UX and speed: Don’t sacrifice one for the other – fortunately, in most cases, improving speed improves UX. But always consider the user impact of any change.
As an experienced SEO and WordPress consultant, I’ll add: page experience is one of those areas you have significant control over. You can’t magically force Google to rank you #1 for a competitive keyword if your content is mediocre, but you can make your site faster and better than your competitors’. It’s a bit of a leveling factor – smaller sites that invest in performance can punch above their weight. We saw examples where just improving vitals led to traffic and sales boosts without any new content.
So, where to start optimizing? If you haven’t yet, run your site through PageSpeed Insights or WebPageTest now. Identify the low-hanging fruit: maybe it’s image compression, maybe enabling caching. Implement those changes step by step. Use the sections of this guide as a checklist. You don’t have to do everything overnight – even incremental improvements can yield benefits. The key is to start.
Final CTA: Act Now – Before the AI Search Wave Grows
If there’s a single message to take home: Don’t wait. Core Web Vitals is not a one-time fad; it’s an evolving standard. Each day you delay optimization, you potentially lose visitors (who get impatient) and ranking ground (to faster competitors). With Google’s AI Search ramping up, the gap between sites that offer a great experience and those that don’t might become even more pronounced. Early adopters of performance optimization will shine in an AI-driven landscape where quality signals are ever more crucial.
Start optimizing now, and you’ll be ahead of the curve. Measure your current vitals, fix what’s broken, and then push further – turn those “needs improvement” into “good” across the board. Your users will notice, and so will search engines.
Remember, every millisecond you shave off, every layout shift you prevent, every interaction you speed up, is an improvement in your user’s journey. And ultimately, that’s what Google wants to reward. So embark on the path to Core Web Vitals mastery today – your site’s future in the AI-powered web depends on it.
To fast, smooth, and successful websites – happy optimizing!
FAQ Section (15 Common Questions & Answers)
Q1. What is a good INP score for WordPress?
A: A good Interaction to Next Paint (INP) score is 200 milliseconds or less (at the 75th percentile of page loads). This means your site responds to user inputs (taps, clicks, key presses) almost instantly. WordPress sites can achieve this by minimizing render-blocking JavaScript, using caching, and optimizing or deferring heavy plugin scripts. Aim for INP ≤ 0.2s to be in the “Good” range – it indicates your pages feel very responsive to users.
Q2. How do Core Web Vitals affect AI search features like Google’s SGE?
A: Core Web Vitals indirectly influence AI search features. Google’s Search Generative Experience tends to favor content from sites that provide a positive user experience – which includes fast load times and stable layouts. If your site is slow or glitchy, it might be less likely to be included as a cited source in AI overviews, and even if it is, users may skip clicking it. In short, fast = findable: a site with good CWV stands a better chance of being surfaced and clicked in AI-driven results.
Q3. Are Core Web Vitals an official Google ranking factor?
A: Yes. Since the Page Experience update, Core Web Vitals (LCP, FID/INP, CLS) have been part of Google’s ranking signals. However, they are lightweight factors compared to relevance or content quality. Think of CWV as a tiebreaker – if two pages are equally relevant, the one with better page experience can rank higher. They won’t make a low-quality page outrank a high-quality one, but failing CWV could hurt your rankings if competitors have similar content and better vitals.
Q4. What are the current “good” threshold values for each Core Web Vital?
A: The thresholds are: LCP: 2.5 seconds or less (good); INP: 200 milliseconds or less (good); CLS: 0.1 or less (good). These are measured at the 75th percentile of users. “Needs Improvement” ranges are LCP 2.5–4.0s, INP 200–500ms, CLS 0.1–0.25. Anything above those is “Poor.” Staying at “good” or better ensures you pass the Core Web Vitals assessment.
Q5. How can I check my WordPress site’s Core Web Vitals?
A: Use Google PageSpeed Insights (pagespeed.web.dev) – enter your URL and it will show field data (if available) for LCP, INP, CLS and a lab test. Also, Google Search Console’s Core Web Vitals report (under Experience) provides a site-wide overview of URLs that are good or need work for CWV. Additionally, you can use the Web Vitals Chrome extension for a quick check as you browse your site, or tools like GTmetrix and WebPageTest for detailed metrics.
Q6. My site is failing Core Web Vitals – where should I start?
A: Start with the biggest bottleneck. Check PageSpeed Insights’ opportunities. Often for LCP, the main issues are large/unoptimized images or slow server response – so tackle those first (compress images, enable caching/CDN). For INP/FID, long JavaScript tasks are common – identify if a specific script or plugin is causing delay and optimize or remove it. For CLS, look for images without dimensions or ads/widgets injecting content – add size attributes or reserve space. In short, address the “red” flags PSI gives you in order of impact. Implement changes one by one and test improvements.
Q7. Does using many WordPress plugins hurt Core Web Vitals?
A: It can. Each plugin can add its own CSS, JavaScript, or server processing. Over-reliance on plugins – especially heavy ones – can slow down load times and interactivity (INP). For example, if you have multiple sliders, social feeds, etc., each might load assets that bloat your pages. That said, it’s not the sheer number of plugins, but their quality and what they do. A site with 30 lightweight, well-coded plugins may perform better than one with 5 poorly coded heavy plugins. Review your plugins: disable or replace ones that significantly hurt performance. Using a performance profiling plugin (like Query Monitor or P3 Profiler) can help identify any “slow” plugins.
Q8. What’s the difference between First Input Delay (FID) and INP?
A: First Input Delay (FID) measures the delay of the very first user interaction on a page (in milliseconds, good ≤ 100ms). Interaction to Next Paint (INP) is a newer, more comprehensive metric that looks at most interactions a user does and reports (approximately) the worst delay. INP essentially evaluates overall responsiveness, not just the first click. Google replaced FID with INP in March 2024 because INP gives a fuller picture. Practically, if your site was good on FID, you’re partway there, but you need to ensure all interactions are speedy, not just the first one.
Q9. How can I improve LCP on my WordPress site?
A: To improve Largest Contentful Paint:
-
Optimize images: Compress large images, serve them in modern formats (WebP/AVIF), and use proper sizing (srcset) so mobile gets smaller images. Preload your hero image if it’s the LCP element.
-
Enable page caching: This speeds up server response (TTFB), helping LCP start sooner.
-
Eliminate render-blocking resources: Minify and combine critical CSS, defer non-critical JS so the browser can paint content faster.
-
Use a faster host/CDN: If your server is slow, upgrading hosting or using a CDN can shave off time in delivering assets.
-
Reduce heavy above-the-fold content: For example, replace a huge video background with a static image or postpone loading it. The faster you can render the main content, the better the LCP.
Each of these contributes to getting that largest element (whether text or image) to appear within the golden ≤2.5s threshold.
Q10. How do I reduce a high CLS (layout shift) score?
A: To reduce Cumulative Layout Shift:
-
Include width and height for images and videos: This reserves space and prevents jumping when media loads.
-
Reserve space for ads/embeds: Use CSS to give iframes or ad containers a fixed size or responsive aspect ratio so when they load, they don’t shove content around.
-
Use font-display swap/optional for custom fonts: This avoids text being invisible or swapping late (both can cause layout changes).
-
Avoid inserting new DOM elements above existing content unless it’s user-initiated: For instance, don’t dynamically push a banner at the top after load.
-
Stabilize animations: Only animate properties (like transforms) that don’t trigger reflows, and don’t animate layout on load.
Implementing these will ensure elements stay put, and you should see CLS drop below 0.1.
Q11. Does a CDN help with Core Web Vitals?
A: Yes, a Content Delivery Network (CDN) can improve primarily LCP (and somewhat INP if it speeds up loading of scripts). A CDN stores your content on servers around the world, delivering it from locations closer to the user, which reduces network latency. This leads to faster initial content load (helping LCP). CDNs also often compress and optimize asset delivery. However, a CDN doesn’t directly affect CLS (layout stability is unrelated to network) and INP gains are indirect (if files load faster, there’s less delay for interactivity). Overall, using a CDN, especially for global audiences, is a proven way to speed up load times and thus improve Web Vitals.
Q12. Will upgrading my web hosting improve my Core Web Vitals?
A: It can, particularly for LCP. Upgrading to better hosting (or a higher-tier plan) often means faster server response times, and possibly better infrastructure (like built-in caching, HTTP/3 support, etc.). For example, moving from a budget shared host to a managed WordPress host can cut down Time to First Byte, which helps LCP. Faster servers also handle heavy plugins more efficiently, which can indirectly help INP. That said, if your site’s issues are largely front-end (e.g., huge images or heavy JS), hosting alone won’t solve them – you’d still need to optimize those. But a good host provides a strong foundation. In short, good hosting is the canvas; your optimizations are the paint – you ideally want both a fast server and well-optimized site for best CWV.
Q13. How often does Google update the Core Web Vitals metrics?
A: Google doesn’t update the metrics very frequently. Core Web Vitals were introduced in 2020 (LCP, FID, CLS). The first major change was replacing FID with INP in March 2024. So roughly 3-4 years between metric changes. They do continuously fine-tune how these metrics are measured (e.g., small definition tweaks) and could introduce new ones in the future (like a smoothness metric). But they usually announce changes well in advance. The thresholds for “good” have remained the same so far. However, the field data that Google uses is updated monthly (CrUX data). For you, this means if you improve your site, it can take a few weeks to a couple of months for Search Console to reflect that in the CWV report. Keep an eye on Google’s developer blog for any announcements of metric changes.
Q14. Can Core Web Vitals impact desktop rankings or only mobile?
A: Core Web Vitals impact both mobile and desktop rankings. Initially, the Page Experience update (2021) was mobile-only. But in February 2022, Google rolled out page experience as a ranking signal for desktop as well. They use the respective CWV data for each (so your desktop CWV and mobile CWV are evaluated separately). In Search Console you have reports for both. Many sites find desktop CWVs are easier to pass (since desktops are more powerful devices), but it’s important to optimize for mobile where things are slower. If your mobile vitals are good, likely your desktop will be too. But yes, since early 2022, desktop search results also take into account CWV signals. So don’t ignore your desktop experience (e.g., large screen images, layout issues on wide displays can affect desktop CLS/LCP).
Q15. What’s the relationship between Core Web Vitals and “evergreen content”?
A: “Evergreen content” refers to high-quality content that remains relevant over time. While it’s not directly related to Core Web Vitals (which are about page performance), there’s a holistic SEO perspective: a site that produces evergreen content and also provides a fast, excellent user experience is poised to rank better and retain visitors. You can think of it this way: Content is king, but performance is the queen that keeps the kingdom running smoothly. If you have authoritative evergreen articles but they load painfully slow, users might not stay to read them – undermining the value of that content. Conversely, a fast site with thin content won’t rank because substance is lacking. So, the best strategy is to pair evergreen (or generally great) content with strong Core Web Vitals. That way, users find your content easily and enjoy consuming it, which sends positive signals back to Google (like longer dwell time). In summary, focus on content and CWV in tandem: publish evergreen, people-first content and ensure the technical delivery of that content is top-notch (fast and user-friendly).